
Monitor your
Hermes health
Check your setup
See CPU, memory and disk usage, run Doctor or a security audit, and read backend logs. Switch profiles to check model access, tools, connectors and scheduled tasks.
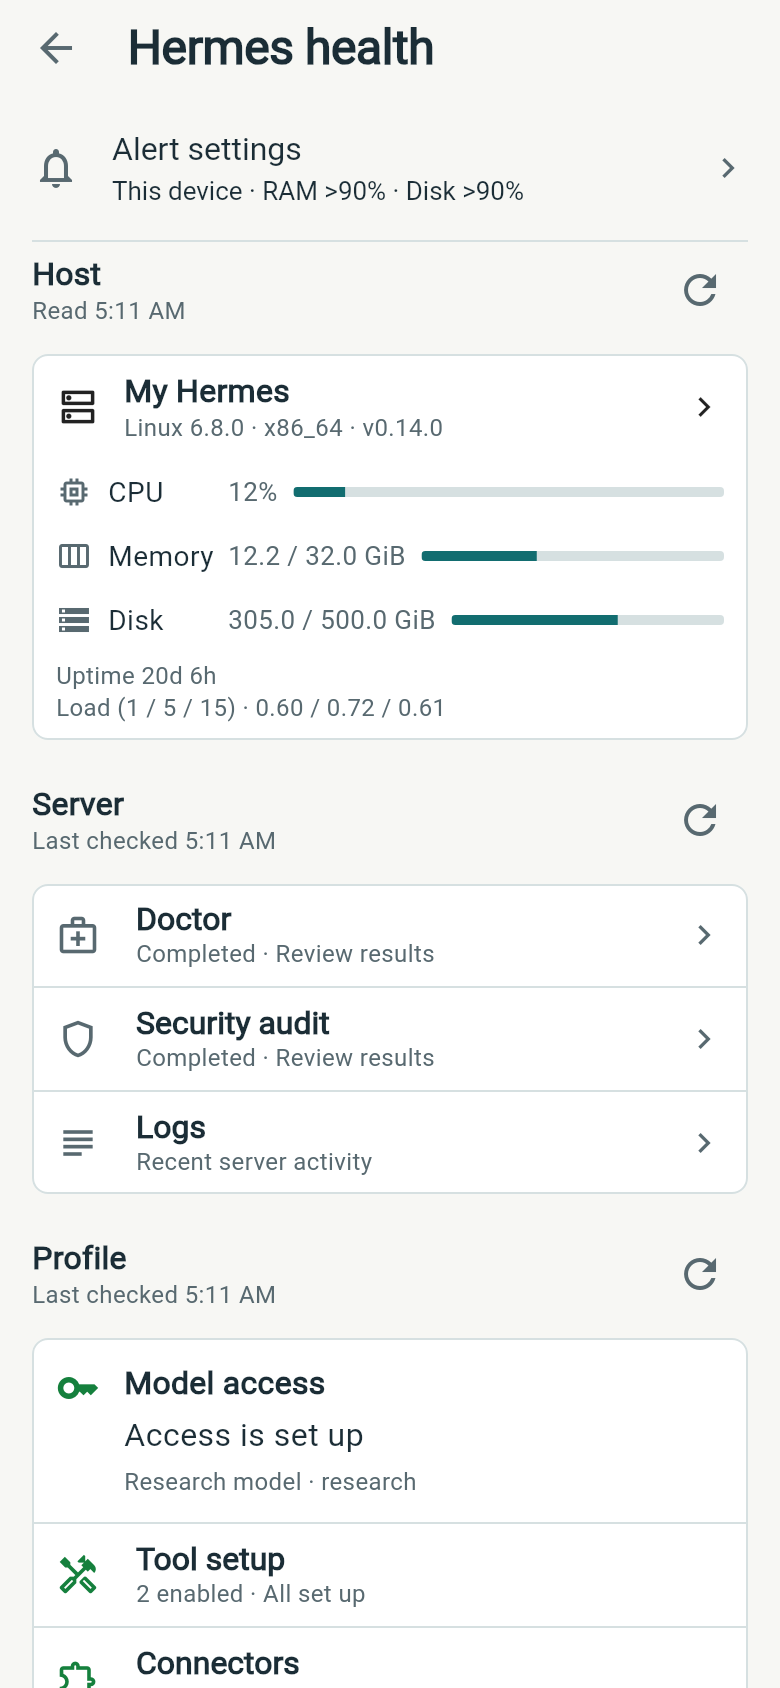
Each result shows when it was checked. Open What's checked? for the scope of each check.
Choose your alerts
Open Alert settings in Health. Enable alerts for host resources, backend connection failures or profile problems. Set memory, disk and CPU warning and recovery thresholds, with separate durations.
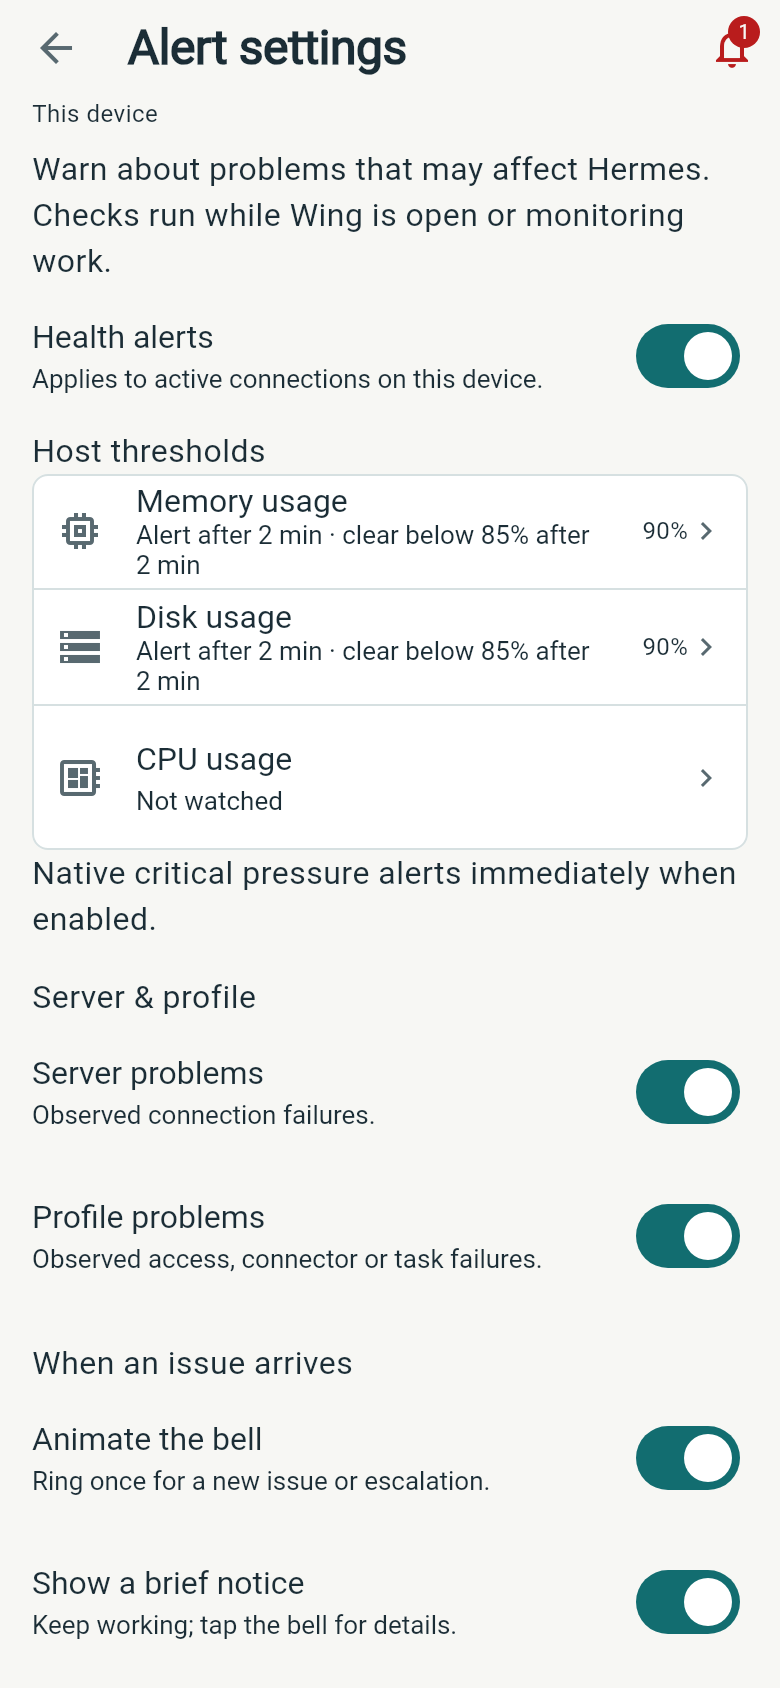
Checks run while Wing is open or monitoring ongoing work. If fresh readings are unavailable, existing issues are marked as last known.
Inspect a notification
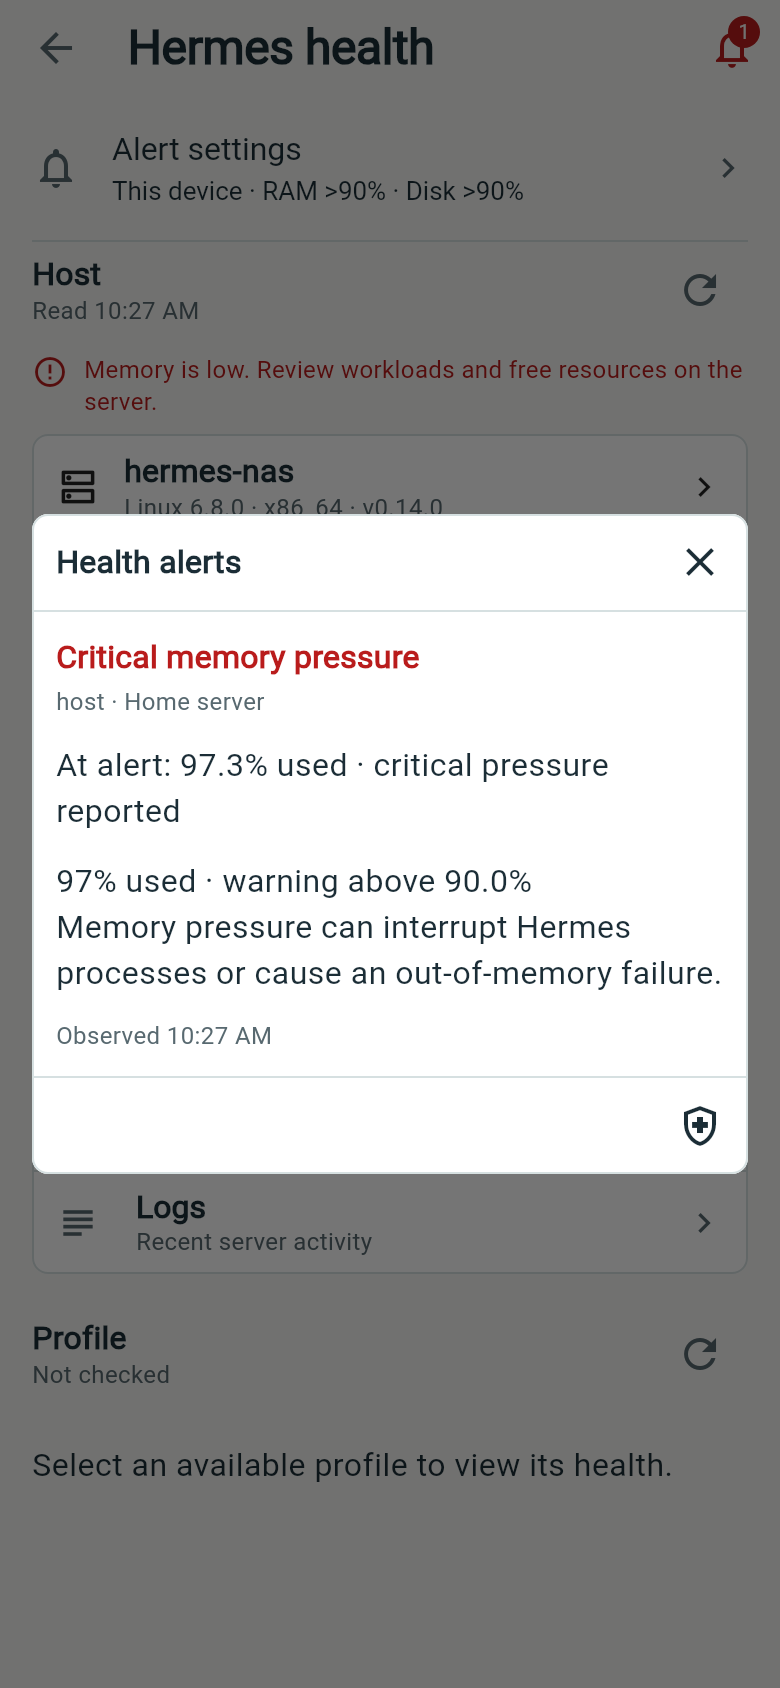
Tap the bell on any screen to see the affected connection and what triggered the issue. Open Health to investigate. The issue leaves the bell when it resolves.