

Review activity
and token usage
Compare periods and models
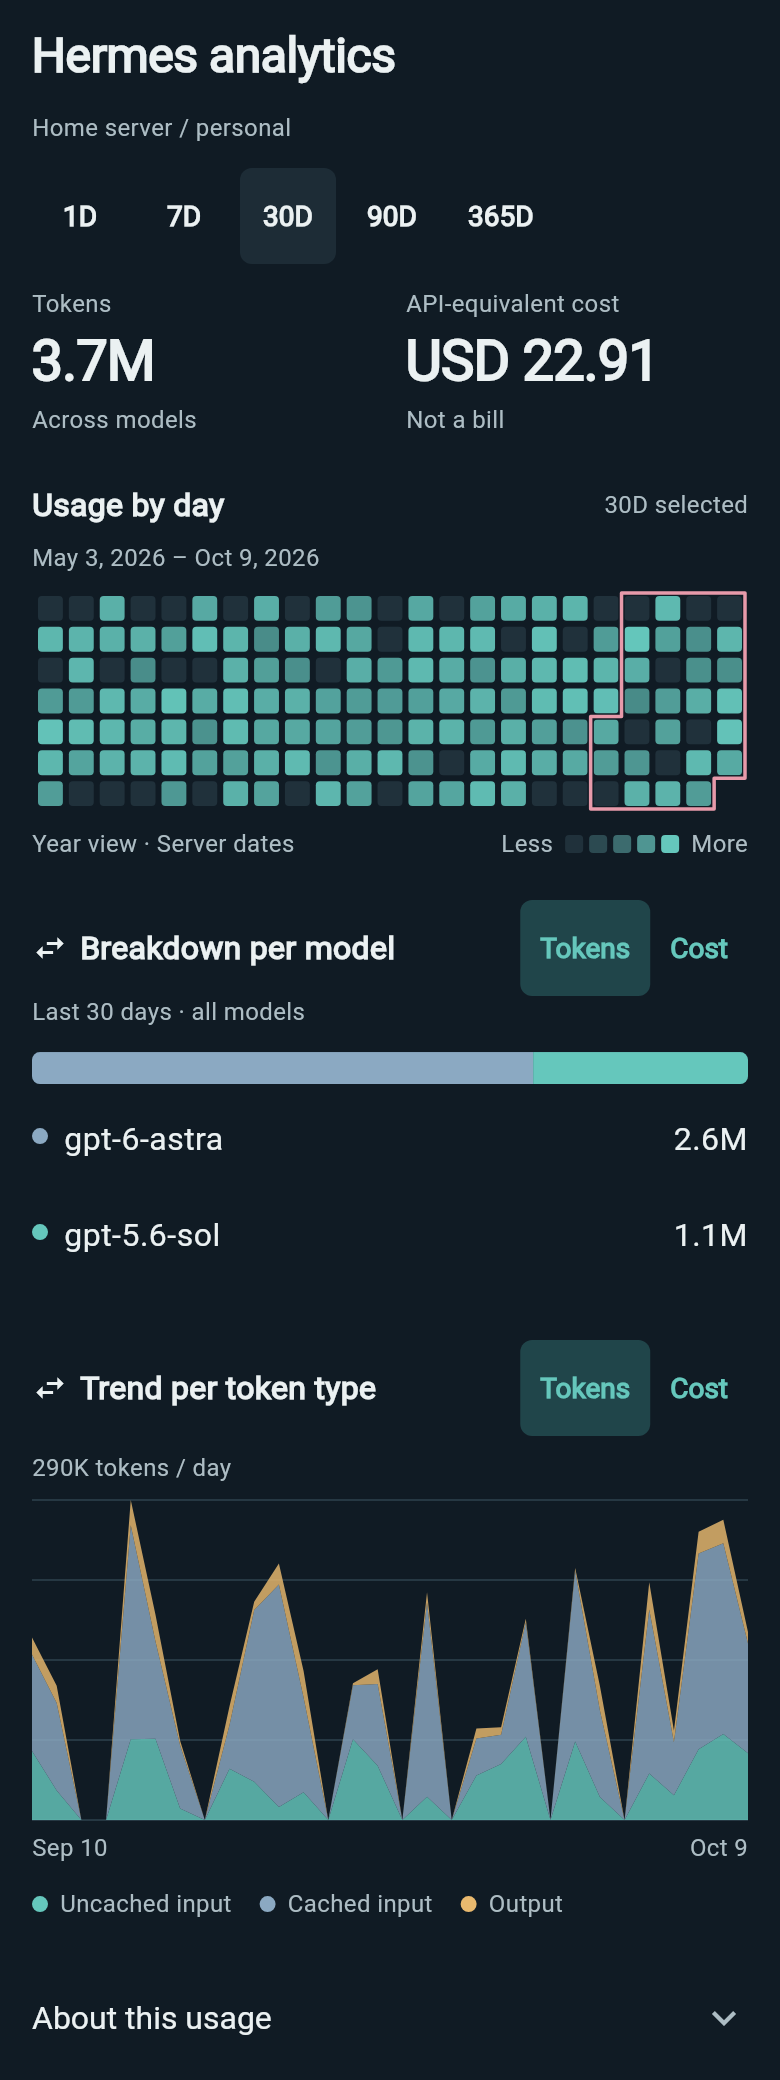
Open Hermes analytics and choose a profile. Switch between 1, 7, 30, 90 or 365 days to view activity, tokens and model breakdowns for that period.
Browse daily activity
The year view shows daily activity in a scrollable grid. Select a day or change the chart grouping to inspect activity and token usage. Refresh to fetch updated readings.
Understand the cost figures
Cost figures are estimates, not bills. Subscription usage can show an API-equivalent cost: what the recorded tokens would cost at API rates, rather than what your subscription charged.
Missing prices stay unavailable, and partial totals are labeled. Open the explanation in analytics to see what the estimate includes.